
by Alana Tanasescu | Apr 29, 2021 | Infographics, Retargeting tool, Retargeting Updates, Technology
We have decided to work on an extra feature and not take into consideration bot traffic of any kind when counting monthly sessions. As a result, our loyal customers will no longer have to bear the additional costs for non-human traffic to their websites.
by Andreea Handoca | May 10, 2018 | Infographics
Every year, video is poised to become the next big marketing tactic to pull off record engagement on social media and conversions across various digital outposts.
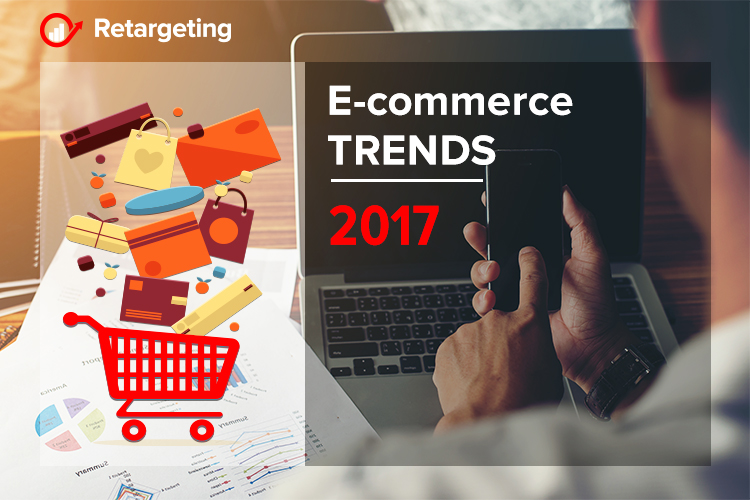
by retargeting | Jun 16, 2017 | Infographics
Consumer surveys state that 95 percent of Americans shop yearly online, and according to Ecommerce News Europe, 60% of Europeans with internet access shopped online once a month. Additionally, the frequency of online deals is growing exponentially. Nearly 51 percent of Americans confirm that their loyalties are shifting from marketplaces to e-stores. The e-commerce trendsetter of 2017 is that 62 percent of smartphone users are making online purchases through their mobiles. If your business is losing steam in a maze of marketplaces, it’s high time you quit running and become airborne. Capitalize on the latest e-commerce trends to sharpen your business trajectory. This is the way to do it: Be online 24/7, 365 days When you’re sleeping, buyers overseas are hitting the mall keyed up to buy. Being online 24/7 ensures you’re there to catch eager shoppers. Surveys tell you that marketplaces are seeing business share plummeting to 45 percent, while branded e-store sales are soaring by 55 percent. This is your opportunity to build a loyal brand following in cyberspace. Make social selling your business multiplier Statistics detailing the business impact of social media are revealing. Over 20 percent of Facebook followers, 14 percent of Instagram users, and 10 percent of Snapchat users are gravitating to e-stores spurred by a flood of advertisements, product sharing, and attractive offers. A combination of product information sharing on Facebook, visually appealing advertisements on Instagram and customer interactive branding on Snapchat will effectively channel traffic to your e-store and escalate conversions. Tell your customers you’re there to fulfill their every need Understanding consumer behavior is the most important step in...
by retargeting | May 2, 2017 | Infographics
Thanks to the latest E-mail Marketing Infographic, we’ve found out some special insights about how people behave in certain situations regarding their daily e-mail reading routine. We would like to share important facts with you, so bear with us through this article, as we’ll be giving the best tips to help improve the brand communication. (Read more…)

by Andreea Handoca | Dec 19, 2016 | Infographics
Email is not dead. In fact this year, email usage is at an all time high and that’s why marketers invest more and more in this channel. Even if in the last 2 years more and more articles, appeared in the media, stating that email is on its last legs, those statements couldn’t be further from the truth. (Read more…)
![Back to school eCommerce stats 2015 [Infographic]](https://blog.retargeting.biz/wp-content/uploads/2015/08/Back-To-School-Ecommerce-Infographic.png)
by retargeting | Aug 28, 2015 | Infographics
All marketers will always try to find out more and more about their consumer behavior, so they can deliver the best product, at the best price, in the best moment in order to increase their sales. Speaking about the best moment, marketers already know when their business performs better – if you sell ice cream, summer is the best season for you, if you sale winter clothes, then winter is your favorite one. The retail industry has its great seasons and it seems that Back-to-school it’s one of them. Actually, this is the second largest time of year for retail sales. Students buy a lot of things! Here are some statistics from 2014, according to Nextopia: 96 % buy school supplies; 91% buy clothing; 82% buy shoes; 66% buy backpack or book bags; 9% buy computer software or small accessories. It looks like some industries have a lot of benefits in this period! Yes, Back-to-school it’s a big opportunity, but you do need to review you strategy – think about what people love about your products and why would they buy them right now. People love this period but they are not willing to open up their wallets just like that. Some statistics show that discounts can be a great influence for your shoppers. You should try a retargeting strategy if you want to give them an incentive to make a decision. Trust us, this really works! Read the infographic below to find out what every online retailer should know about Back-to-School season in 2015! Start your free trial now Sources: – http://heroicsearch.com/back-school-ecommerce-stats/ – http://www.nextopia.com/blog/2014/08/ecommerce-infographic-back-to-school/ – http://www.pfsweb.com/blog/2015-back-to-school-infographic-digital-retail-and-ecommerce/ – http://www.mytotalretail.com/article/best-class-merchandising-tactics-back-school-e-commerce-success/ – http://www.godatafeed.com/blog/10-back-to-school-ecommerce-stats-to-know-for-2015/ Photo credits: – http://www.pfsweb.com/blog/2015-back-to-school-infographic-digital-retail-and-ecommerce/...